–The best characterized metabolic phenotype observed in tumour cells is the Warburg effect (areobic glycolysis 有氧醣解, 2ATP).
This effect is regulated by the PI3K, hypoxia-indicible factor (HIF), p53, MYC and AMP-activated protein kinase (AMPK)–liver kinase B1 (LKB1/STK11) pathways.
–It is becoming clear that alterations to metabolism balance the need of the cell for energy with its equally important need for macromolecular building blocks and maintenance of redox balance. To this end, a key molecule produced as a result of altered cancer metabolism is reduced nicotinamide adenine dinucleotide phosphate (NADPH), which functions as a cofactor and provides reducing power in many enzymatic reactions that are crucial for macromolecular biosynthesis. NADPH is also an antioxidant and forms part of the defence against reactive oxygen species (ROS) that are produced during rapid proliferation.
–High levels of ROS can cause damage to macromolecules, which can induce senescence and apoptosis.
Cells counteract the detrimental effects of ROS by producing antioxidant molecules, such as reduced glutathione (GSH) and thioredoxin (TRX).
–In addition to the genetic changes that alter tumour cell metabolism, the abnormal tumour microenvironment
— such as hypoxia, pH and low glucose concentrations — have a major role in determining the metabolic phenotype of tumour cells.
> 80 enzymes uses alpha -KG as cofactor.
BRCA1 –> NRF2 –> ROS
Estrogen –> PI3K –> mTOR –> NRF2 increases (J Exp Med 2013 and PNAS 2014/Mar)
 Figure 1 | Determinants of the tumour metabolic phenotype. The metabolic phenotype of tumour cells is controlled by intrinsic genetic mutations and external responses to the tumour microenvironment. Oncogenic signalling pathways controlling growth and survival are often activated by the loss of tumour suppressors (such as p53) or the activation of oncoproteins (such as PI3K). The resulting altered signalling modifies cellular metabolism to match the requirements of cell division. Abnormal microenvironmental conditions such as hypoxia, low pH and/or nutrient deprivation elicit responses from tumour cells, including autophagy, which further affect metabolic activity. These adaptations optimize tumour cell metabolism for proliferation by providing appropriate levels of energy in the form of ATP, biosynthetic capacity and the maintenance of balanced redox status.
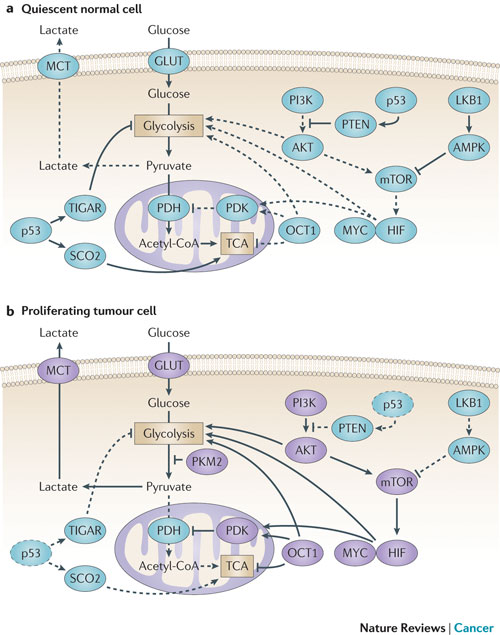
Figure 2 : Molecular mechanisms driving the Warburg effect. (part a) the shift to aerobic glycolysis in tumour cells (part b) is driven by multiple oncogenic signalling pathways. PI3K activates AKT, which stimulates glycolysis by directly regulating glycolytic enzymes and by activating mTOR. The liver kinase B1 (LKB1/STK11) tumour suppressor, through AMP-activated protein kinase (AMPK) activation, opposes the glycolytic phenotype by inhibiting mTOR. mTOR alters metabolism in a variety of ways, but it has an effect on the glycolytic phenotype by enhancing hypoxia-inducible factor 1 (HIF1) activity, which engages a hypoxia-adaptive transcriptional programme. HIF1 increases the expression of glucose transporters (GLUT), glycolytic enzymes and pyruvate dehydrogenase kinase, isozyme 1 (PDK1), which blocks the entry of pyruvate into the tricarboxylic acid (TCA) cycle. MYC cooperates with HIF in activating several genes that encode glycolytic proteins, but also increases mitochondrial metabolism. The tumour suppressor p53 opposes the glycolytic phenotype by suppressing glycolysis through TP53-induced glycolysis and apoptosis regulator (TIGAR), increasing mitochondrial metabolism via SCO2 and supporting expression of PTEN. OCT1 (also known as POU2F1) acts in an opposing manner to activate the transcription of genes that drive glycolysis and suppress oxidative phosphorylation. The switch to the pyruvate kinase M2 (PKM2) isoform affects glycolysis by slowing the pyruvate kinase reaction and diverting substrates into alternative biosynthetic and reduced nicotinamide adenine dinucleotide phosphate (NADPH)-generating pathways. MCT, monocarboxylate transporter; PDH, pyruvate dehydrogenase. The dashed lines indicate loss of p53 function.
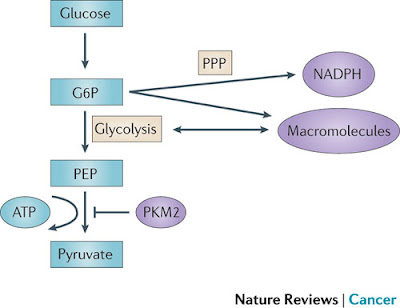
Figure 3 | PKM2 and its effect on glycolysis and the pentose phosphate pathway (PPP). Pyruvate kinase isoform M2 (PKM2) is present in very few types of proliferating normal cells but is present at high levels in cancer cells. PKM2 catalyses the rate-limiting step of glycolysis, controlling the conversion of phosphoenolpyruvate (PEP) to pyruvate, and thus ATP generation. Although counterintuitive, PKM2 opposes the Warburg effect by inhibiting glycolysis and the generation of ATP in tumours. Although such an effect might at first seem to be detrimental to tumour growth, the opposite is true. By slowing the passage of metabolites through glycolysis, PKM2 promotes the shuttling of these substrates through the pentose phosphate pathway (PPP) and other alternative pathways so that large quantities of reduced nicotinamide adenine dinucleotide phosphate (NADPH) and other macromolecules are produced. These molecules are required for macromolecule biosynthesis and the maintenance of redox balance that is needed to support the rapid cell division that occurs within a tumour. G6P, glucose-6-phosphate.
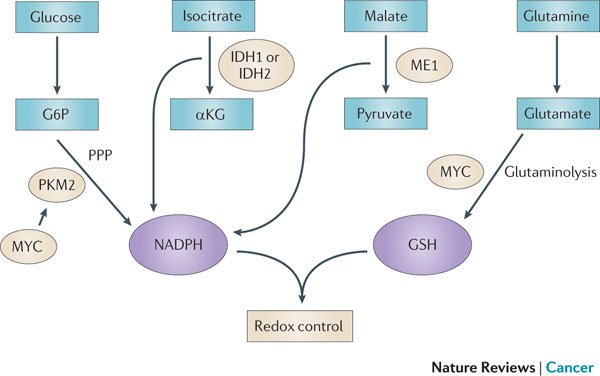
Figure 4 : Mechanisms of redox control and their alterations in cancer. The production of two of the most abundant antioxidants, reduced nicotinamide adenine dinucleotide phosphate (NADPH) and glutathione (GSH), has been shown to be modulated in cancers. Pyruvate kinase isoform M2 (PKM2), which is overexpressed in many cancer cells, can divert metabolic precursors away from glycolysis and into the pentose phosphate pathway (PPP) to produce NADPH. NADP-dependent isocitrate dehydrogenase 1 (IDH1), IDH2 and malic enzyme 1 (ME1) also contribute to NADPH production. MYC increases glutamine uptake and glutaminolysis, driving the de novo synthesis of GSH. Additionally, MYC contributes to NADPH production by promoting the expression of PKM2. Together, NADPH and GSH control increased levels of reactive oxygen species (ROS) driven by increased cancer cell proliferation. αKG, α-ketoglutarate; G6P, glucose-6-phosphate.
 Figure 5 : IDH1 and IDH2 mutations cause an oncometabolic gain of function. Certain somatic mutations at crucial arginine residues in isocitrate dehydrogenase 1 (IDH1, which is cytoplasmic) and IDH2 (which is mitochondrial) are common early driver mutations in glioma and acute myeloid leukaemia (AML). These mutations are unusual because they cause the gain of a novel enzymatic activity. Instead of isocitrate being converted to α-ketoglutarate (αKG) with the production of reduced nicotinamide adenine dinucleotide phosphate (NADPH), αKG is converted to 2-hydroxyglutarate (2-HG) with the consumption of NADPH. 2-HG builds up to high levels in tumour cells and tissues of affected patients and supports tumour progression by a mechanism that is yet to be determined. TCA, tricarboxylic acid cycle.
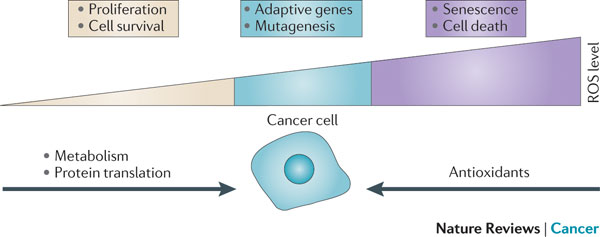
FIGURE 6 | Relationship between the levels of ROS and cancer. The effect of reactive oxygen species (ROS) on cell fate depends on the level at which ROS are present. Low levels of ROS (yellow) provide a beneficial effect, supporting cell proliferation and survival pathways. However, once levels of ROS become excessively high (purple), they cause detrimental oxidative stress that can lead to cell death. To counter such oxidative stress, a cell uses antioxidants that prevent ROS from accumulating at high levels. In a cancer cell, aberrant metabolism and protein translation generate abnormally high levels of ROS. Through additional mutations and adaptations, a cancer cell exerts tight regulation of ROS and antioxidants in such a way that the cell survives and the levels of ROS are reduced to moderate levels (blue). This extraordinary control of ROS and the mechanisms designed to counter it allow the cancer cell to avoid the detrimental effects of high levels of ROS, but also increase the chance that the cell will experience additional ROS-mediated mutagenic events and stress responses that promote tumorigenesis. Figure inspired by discussions with Navdeep Chandel, Northwestern University, Chicago, USA.
Presentation/2015_Analysis Process_3.ppt (slide 19) –> Modified Figure 6 by SFL (combined his Youtube on 2012)
Figure 1. The production of reactive oxygen species (ROS) can be induced by hypoxia, metabolic defects, endoplasmic reticulum (ER) stress and oncogenes. Conversely, ROS are eliminated by the activation of the transcription factor nuclear factor erythroid 2-related factor 2 (NRF2), the production of glutathione and NADPH, the activity of tumour suppressors (such as breast cancer susceptibility 1 (BRCA1), p53, phosphatase and tensin homolog (PTEN) and ataxia telangiectasia mutated (ATM)) and the action of dietary antioxidants.
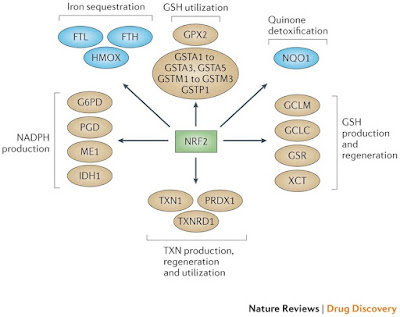
Figure 2: NRF2 as the master regulator of antioxidant responses. Nuclear factor erythroid 2-related factor 2 (NRF2) controls several different antioxidants pathways. The first is glutathione (GSH) production and regeneration, which is regulated by the following antioxidants: the glutamate–cysteine ligase complex modifier subunit (GCLM), the GCL catalytic subunit (GCLC), the cystine/glutamate transporter XCT and glutathione reductase (GSR). The second is GSH utilization, which is regulated by the glutathione S-transferases (GSTA1, GSTA2, GSTA3, GSTA5, GSTM1, GSTM2, GSTM3 and GSTP1) and glutathione peroxidase 2 (GPX2). The third is thioredoxin (TXN) production, regeneration and ultilization, which is regulated by TXN1, thioredoxin reductase 1 (TXNRD1) and peroxiredoxin 1 (PRDX1). The fourth is NADPH production, which is controlled by glucose-6-phosphate dehydrogenase (G6PD), phosphoglycerate dehydrogenase (PHGDH), malic enzyme 1 (ME1) and isocitrate dehydrogenase 1 (IDH1). Both GSH and TXN utilize NADPH to regenerate themselves once they have reduced reactive oxygen species (ROS). These four groups of antioxidant genes — which are all upregulated by NRF2 — have both complementary and overlapping functions. Additional antioxidants that are controlled by NRF2 include NAD(P)H:quinone oxidoreductase 1 (NQO1) and enzymes regulating iron sequestration, such as haem oxygenase (HMOX1), ferritin heavy chain (FTH) and ferritin light chain (FTL)gure 3: NRF2, p53 and FOXOs support complementary antioxidant pathways. Whereas nuclear factor erythroid 2-related factor 2 (NRF2) mainly affects reduced glutathione (GSH)- and NADPH-related responses, forkead box O (FOXO) proteins and the tumour suppressor p53 regulate superoxide dismutases (SODs), catalase, PTEN-induced putative kinase 1 (PINK1) and sestrins. p53 promotes glutaminolysis via glutaminase 2 (GLS2), which produces the glutamate required for GSH synthesis. In addition, both FOXOs and p53 control NRF2 via the expression of cyclin-dependent kinase inhibitor 1A (CDKN1A). NRF2 activity is also controlled positively by breast cancer susceptibility 1 (BRCA1) and negatively by fumarate hydratase (FH). Notably,several NRF2 target genes have not been included in this figure because they do not pertain to antioxidant functions.
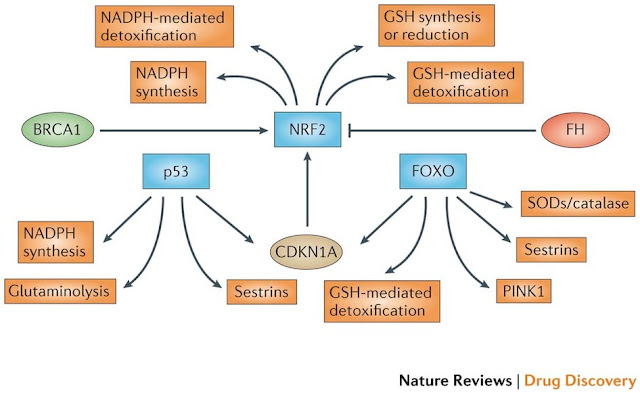
Figure 3: NRF2, p53 and FOXOs support complementary antioxidant pathways. Whereas nuclear factor erythroid 2-related factor 2 (NRF2) mainly affects reduced glutathione (GSH)- and NADPH-related responses, forkead box O (FOXO) proteins and the tumour suppressor p53 regulate superoxide dismutases (SODs), catalase, PTEN-induced putative kinase 1 (PINK1) and sestrins. p53 promotes glutaminolysis via glutaminase 2 (GLS2), which produces the glutamate required for GSH synthesis. In addition, both FOXOs and p53 control NRF2 via the expression of cyclin-dependent kinase inhibitor 1A (CDKN1A). NRF2 activity is also controlled positively by breast cancer susceptibility 1 (BRCA1) and negatively by fumarate hydratase (FH).
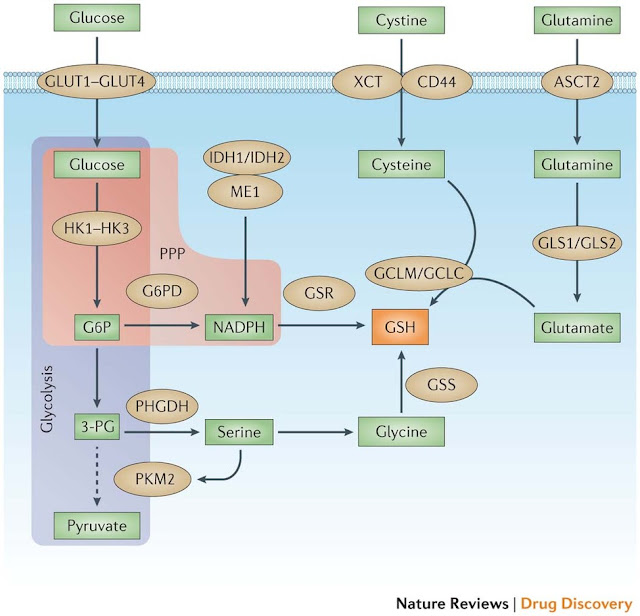
Figure 4: Multiple tumour supporter pathways promote GSH synthesis and regeneration. The two main metabolites that drive cancer cell proliferation and survival are glucose and glutamine. After entering the cancer cell via glucose transporter 1 (GLUT1), GLUT2, GLUT3 or GLUT4 and being converted to glucose-6-phosphate (G6P) by hexokinases (HK1, HK2 or HK3), glucose can enter either the glycolysis pathway or the pentose phosphate pathway (PPP). The M2 isoform of pyruvate kinase, muscle (PKM2) slows glycolysis (dashed arrow) and allows for metabolite diversion into NADPH (via G6P dehydrogenase (G6PD) and the PPP), leading to the regeneration of the reduced form of glutathione (GSH) by glutathione reductase (GSR). NADPH can also be produced by isocitrate dehydrogenase 1 (IDH1) and IDH2 through the conversion of isocitrate to α-ketoglutarate, as well as malic enzyme 1 (ME1) through the conversion of malate to pyruvate. Metabolites diverted owing to PKM2 also promote serine biosynthesis via phosphoglycerate dehydrogenase (PHGDH), which leads to glycine production and, ultimately, de novo GSH production catalysed by glutathione synthetase (GSS). Glutamine, after being converted to glutamate through glutaminolysis via glutaminase 1 (GLS1) or GLS2, can either produce α-ketoglutarate (αKG) and enter the mitochondria (not shown), or react with cysteine to produce GSH via the glutamate–cysteine ligase complex modifier subunit (GCLM) or the GCL catalytic subunit (GCLC). Cysteine levels are controlled two ways: internal generation from methionine (not shown) or imported as cystine (via the cystine/glutamate transporter XCT) and reduced by GSH and/or thioredoxin antioxidant pathways (not shown). Cystine import is promoted by the tumour-associated antigen CD44 through its interaction with — and stabilization of — XCT. ASCT2, sodium-dependent neutral amino acid transporter type 2; 3-PG, 3-phosphoglyceric acid.

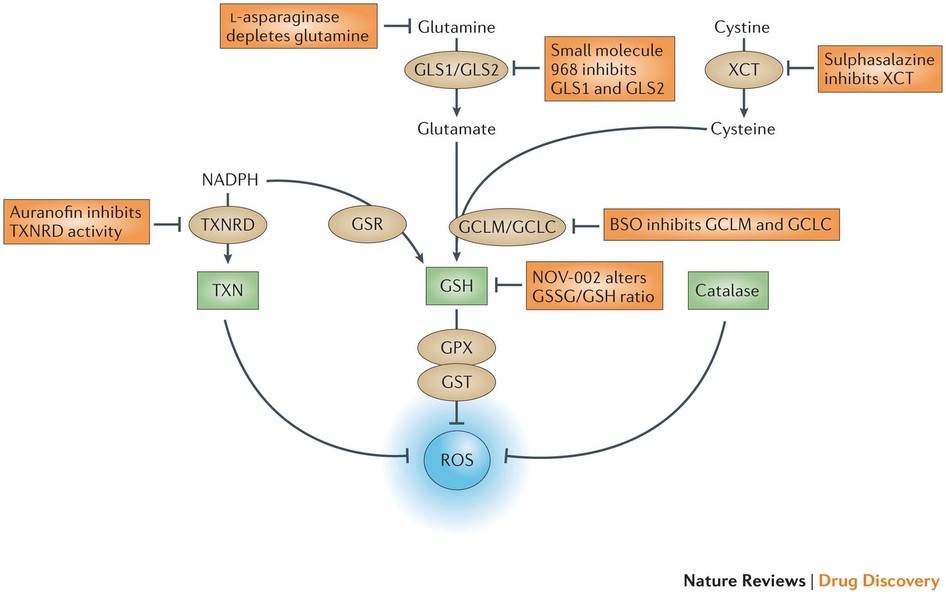
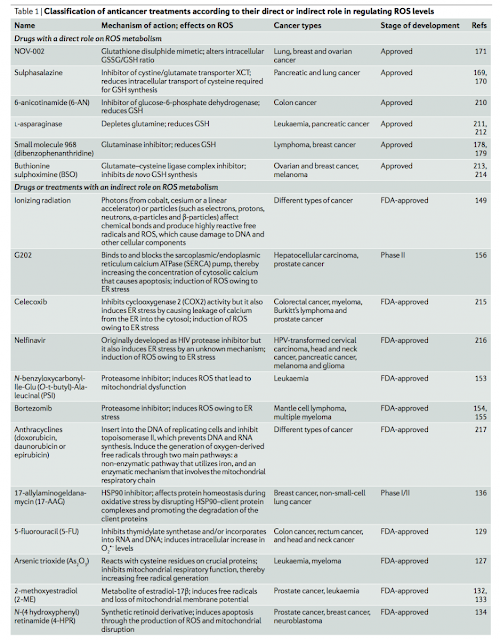
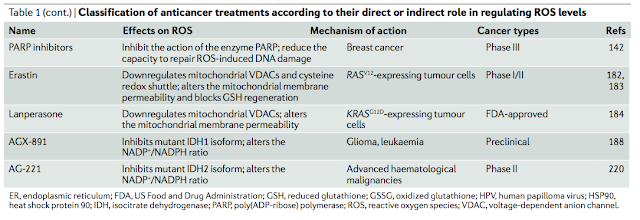
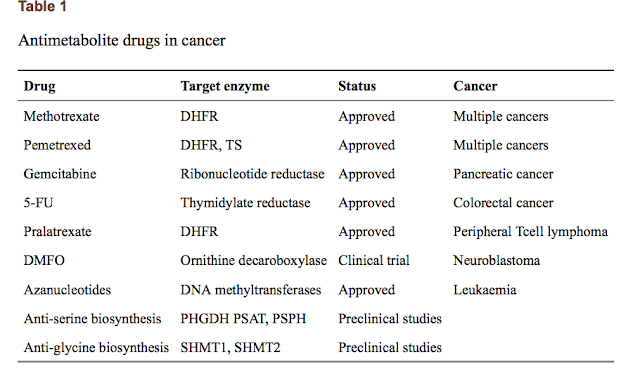
Figure 5: The antioxidant pathways that drive ROS detoxification. There are three main pathways for the elimination of reactive oxygen species (ROS), and these involve reduced glutathione (GSH), thioredoxin (TXN) and catalase. TXN, a protein that reduces ROS levels, can be regenerated by thioredoxin reductase (TXNRD) using the metabolite NADPH. GSH, which can also be regenerated by NADPH via glutathione reductase (GSR), is derived from the metabolites glutamate and cysteine. GSH acts directly on eliminating ROS through the action of glutathione peroxidase (GPX) and glutathione S-transferase (GST). Catalase also acts directly on ROS and resides predominantly in peroxisomes. Glutaminase 1 (GLS1) and GLS2 produce glutamate, and the cystine/glutamate transporter XCT provides cysteine for the production of GSH through the action of the glutamate–cysteine ligase modifier subunit (GCLM) and the GCL catalytic subunit (GCLC). Whereas both TXN and GSH pathways rely heavily on NADPH production for sustaining their activity, catalase acts independently of NADPH. All three of these pathways contain key enzymes that could be specifically targeted to inhibit antioxidant responses within cancer cells. The figure also shows the anticancer drugs listed in Table 1 that exert a direct effect on glutathione metabolism. BSO, buthionine sulphoximine.
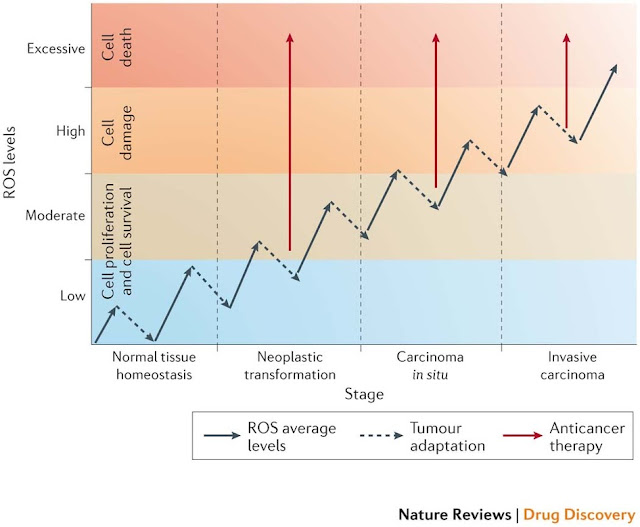
Figure 6: Interplay between ROS regulation and tumorigenesis at different stages. During the transition phases from normal tissue to invasive carcinoma, cells experience a progressive increase in reactive oxygen species (ROS) levels owing to metabolic aberrations acquired following transformation (represented by the solid arrows)209. Cancer cells escape cell death and damage induced by high ROS levels by increasing their antioxidant defences that lower ROS levels (dashed arrows). We propose to target the antioxidant mechanisms of tumour adaptation by an anticancer therapy that forces the accumulation of excessive ROS and the induction of cell death (solid red arrows). This can be achieved by treating cancer cells either with ROS-inducing therapies or with antioxidant-inhibiting therapies.
#1由 sufang 在 一, 11/03/2014 – 15:39 發表。Trends Biochem Sci: Serine and glycine metabolism in cancer
Serine and glycine are biosynthetically linked, and together provide the essential precursors for the synthesis of proteins, nucleic acids, and lipids that are crucial to cancer cell growth. Moreover, serine/glycine biosynthesis also affects cellular antioxidative capacity, thus supporting tumour homeostasis. A crucial contribution of serine/glycine to cellular metabolism is through the glycine cleavage system, which refuels one-carbon metabolism; a complex cyclic metabolic network based on chemical reactions of folate compounds. The importance of serine/glycine metabolism is further highlighted by genetic and functional evidence indicating that hyperactivation of the serine/glycine biosynthetic pathway drives oncogenesis. Recent developments in our understanding of these pathways provide novel translational opportunities for drug development, dietary intervention, and biomarker identification of human cancers. PMID: 24657017
cancer metabolism; folate; glycine; one-carbon metabolism; serine
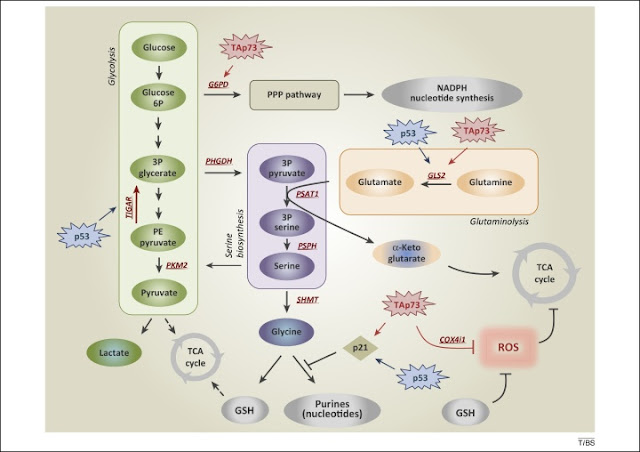
Figure 1. De novo serine biosynthesis diverges from glycolysis. The serine synthesis pathway utilises the glycolytic intermediate 3P-glycerate, which is converted by PHGDH, PSAT-1, and PSPH into serine. Removal of exogenous serine causes activation of its biosynthetic pathway. Serine accumulation accelerates glycolytic flux, although allosteric activation of PKM2 by serine. p53, via TIGAR, and TAp73, via G6PD, facilitate activation of the PPP, promoting NADPH and nucleotide synthesis. p53-dependent activation of p21 induces transient cell cycle arrest, blocking flux to purines, thus maintaining GSH synthesis. TAp73 drives glutamine/glutamate conversion by inducing expression of GLS-2, thus pushing serine biosynthetic pathway, while it represses intracellular ROS controlling COX4i1 subunit expression. Abbreviations: 3P glycerate, glycerate-3-phosphate; PHGDH, phosphoglycerate dehydrogenase; PKM2, pyruvate kinase M2; PPP, pentose phosphate pathway; ROS, reactive oxygen species; COX4i1, cytochrome C oxidase subunit 4 isoform 1; G6PD, glucose-6-phosphate dehydrogenase; GLS-2, glutaminase-2; GSH, glutathione; PSAT-1, phosphoserine aminotransferase 1; PSPH, phosphoserine phosphatase; TIGAR, TP53-inducible glycolysis and apoptosis regulator.
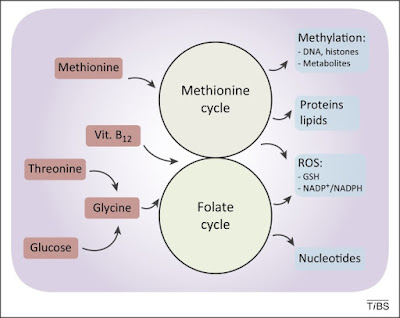
Figure 2. De novo synthesised or imported serine and glycine refuel one-carbon metabolism. One-carbon metabolism comprises two interconnected metabolic cycles: the folate cycle and the methionine cycle. Different de novo or imported inputs (red boxes), including glycine derived from serine and vitamin B12, converge in this bimodular metabolic pathway. The. complex process produces multiple outputs (blue boxes), including substrates for methylation reactions, proteins, lipids, nucleotides, and reducing power against reactive oxygen species (ROS).
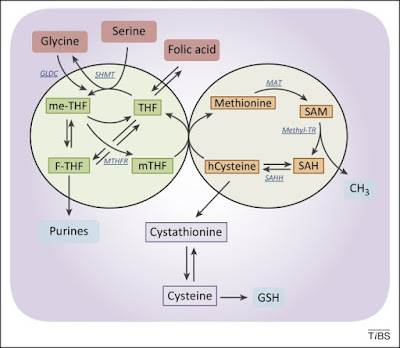
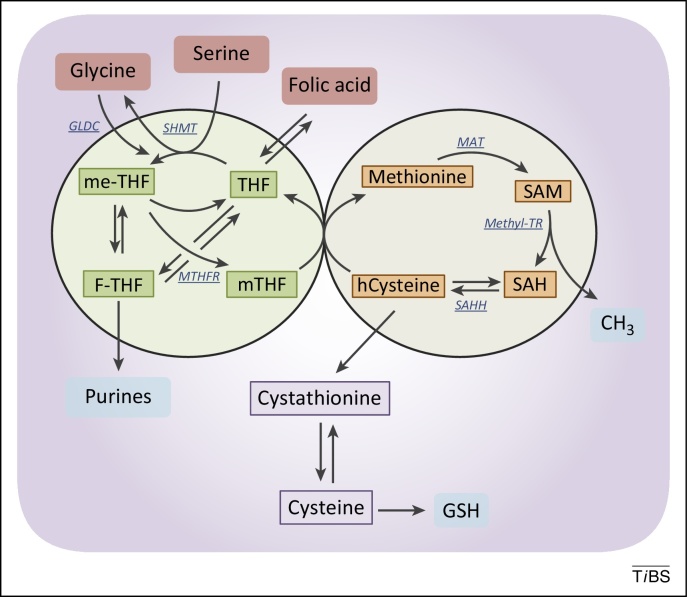
Figure 3. The folate and the methionine cycles exist and can be modulated independently. Imported folic acid can be converted into reduced to THF and enter the folic cycle. THF is in turn converted to me-THF by SHMT. me-THF is then either converted to F-THF or reduced to mTHF by MTHFR. Demethylation of mTHF completes the folate cycle and begins the methionine cycle, converting hCysteine to methionine. Methionine is used to generate SAM, which is demethylated to form SAH. After deadenylation by SAHH, the cycle performs a full turn with the conversion of SAH in homocysteine. Abbreviations: F-THF, 10-formyltetrahydrofolate; hCysteine, homocysteine; me-THF, 5,10-methylene-THF; mTHF, 5-methyltetrahydrofolate; MTHFR, methylenetetrahydrofolate reductase; SAH, S-adenosylhomocysteine; SAHH, S-adenosyl homocysteine hydrolase; SAM, S-adenosylmethionine; SHMT, serine hydroxymethyl transferase; THF, tetrahydrofolate; MAT, methionine adenosyltransferase; Methyl-TR, methyl-transferase.
#2由 sufang 在 一, 11/03/2014 – 15:33 發表。
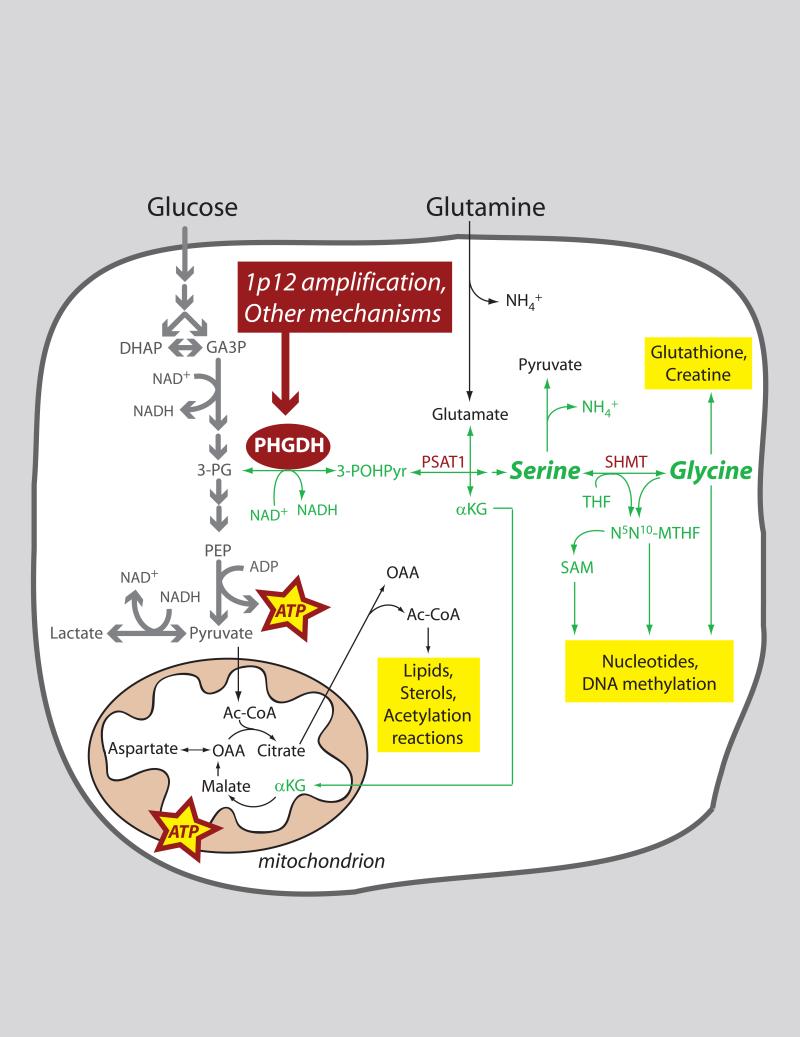
Cell Metab. 2011 Comment on the PHGDH papers
Cell Metab. 2011 Sep 7;14(3):285-6. Serine metabolism: some tumors take the road less traveled.
DeBerardinis RJ.
Role of PHGDH in tumor cell metabolism.
Many tumors have enhanced expression of the metabolic enzyme phosphoglycerate (PHGDH), in some cases because the gene encoding this enzyme is amplified on chromosome 1p12. PHGDH diverts flux away from glycolysis by oxidizing 3-phosphoglycerate (3-PG) to 3-phospho-hydroxypyruvate (3-POHPyr). Subsequent metabolism of this 3-carbon intermediate feeds into the serine and glycine pools, providing numerous precursor molecules and other substrates required for cell growth and proliferation. Abbreviations: Ac-CoA, acetyl-CoA; αKG, α-ketoglutarate; DHAP, dihydroxyacetone phosphate; GA3P, glyceraldehyde-3-phosphate; NH4+, ammonium ion; N5N10-MTHF, N5,N10-methylene tetrahydrofolate; OAA, oxaloacetate; PEP, phosphoenolpyruvate; PSAT1, phosphoserine aminotransferase-1; SAM, S-adenosylmethionine; SHMT, serine hydroxymethyltransferase; THF, tetrahydrofolate. (Cell Metab. 2011, 14: p285)
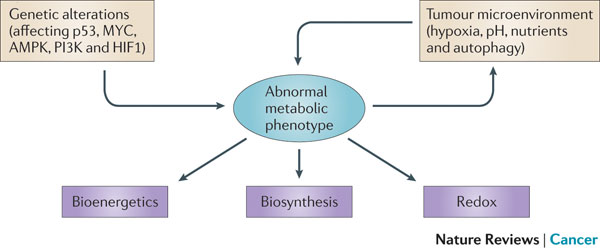 Figure 1 | Determinants of the tumour metabolic phenotype. The metabolic phenotype of tumour cells is controlled by intrinsic genetic mutations and external responses to the tumour microenvironment. Oncogenic signalling pathways controlling growth and survival are often activated by the loss of tumour suppressors (such as p53) or the activation of oncoproteins (such as PI3K). The resulting altered signalling modifies cellular metabolism to match the requirements of cell division. Abnormal microenvironmental conditions such as hypoxia, low pH and/or nutrient deprivation elicit responses from tumour cells, including autophagy, which further affect metabolic activity. These adaptations optimize tumour cell metabolism for proliferation by providing appropriate levels of energy in the form of ATP, biosynthetic capacity and the maintenance of balanced redox status.


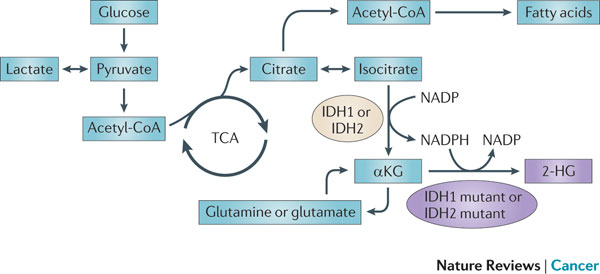 Figure 5 : IDH1 and IDH2 mutations cause an oncometabolic gain of function. Certain somatic mutations at crucial arginine residues in isocitrate dehydrogenase 1 (IDH1, which is cytoplasmic) and IDH2 (which is mitochondrial) are common early driver mutations in glioma and acute myeloid leukaemia (AML). These mutations are unusual because they cause the gain of a novel enzymatic activity. Instead of isocitrate being converted to α-ketoglutarate (αKG) with the production of reduced nicotinamide adenine dinucleotide phosphate (NADPH), αKG is converted to 2-hydroxyglutarate (2-HG) with the consumption of NADPH. 2-HG builds up to high levels in tumour cells and tissues of affected patients and supports tumour progression by a mechanism that is yet to be determined. TCA, tricarboxylic acid cycle.